NIFTY 50 Today, November 3, 2026: 33 Stocks Rise, Index Increases 219 to 23,659
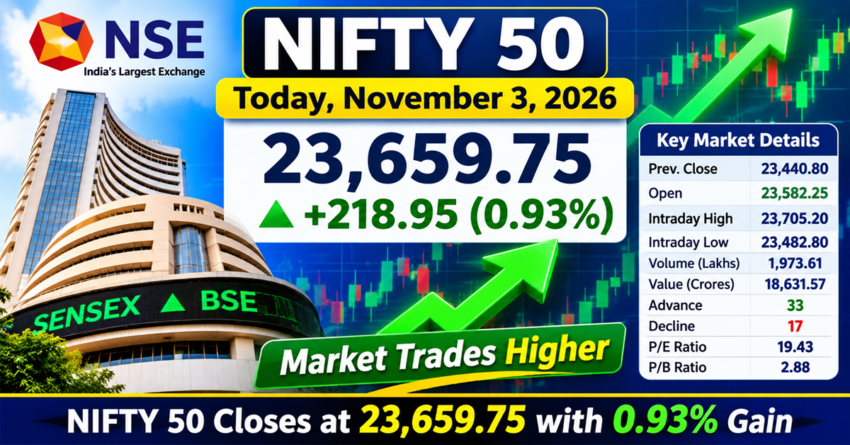
Indian stock market gained on Tuesday, November 3, 2026 NIFTY 50 was higher in the morning trade session The index has increased by 23,659.75, 218.95 points, or 0.93% when compared to the previous day’s closing value of 23,440.80.
Meta description: NIFTY 50 today, November 3, 2026: Index gains 218.95 points to 23,659.75. Check market breadth, trading volume, P/E ratio, support and resistance levels.
Market opened on a positive note at 23,582.25 and continued to build upon its gains in the first half. As of 12:16 pm, the latest market data, the barometer was trading near its intraday high, suggesting that investor sentiment was positive.
It is also positive to note the buying interest was broad-based – 33 stocks gained, 17 fell, implying there was buying pressure from many of the NIFTY 50 stocks.
NIFTY 50 Today: Top Market Highlights
Based on the most recent market data, the NIFTY 50 index closed on November 3, 2026 as follows:
| Market Details | Current Data |
| NIFTY 50 | 23,659.75 |
| Points Gained | 218.95 |
| Percentage Gain | 0.93% |
| Previous Close | 23,440.80 |
| Opening Level | 23,582.25 |
| Intraday High | 23,705.20 |
| Intraday Low | 23,482.80 |
| Advancing Stocks | 33 |
| Declining Stocks | 17 |
| Unchanged Stocks | 0 |
| P/E Ratio | 19.43 |
| P/B Ratio | 2.88 |
This index is advancing at a good pace and high speed today. The index’s positive close indicates a faster trading session for us than yesterday’s close.
NIFTY 50 Market Update: Buyers Continue to Lead
The NIFTY 50 opened higher for the new week at 23,582.25 as compared to its last close of 23,440.80. In the course of the day, the NIFTY index climbed up to the value of 23,705.20 to register an intraday high.
The lowest level seen during the session was 23,482.80. The index was trading at 23,659.75 around 12:16 pm which was an increase of almost 0.93%.
The drop from the initial opening level to its current value shows the index is still holding on to most of its gains from earlier trading.
Market will be watching whether NIFTY 50 sustains this positive trend or not in rest of the trading hours.
Market Breadth Bullish Sentiment Pointed Out
A good market breadth was one of the positive indicators during Tuesday’s trading.
Out of 50 companies that are listed in NIFTY 50:
33 stocks were trading higher.
17 stocks were trading lower.
No stocks remained unchanged.
The increased number of stocks that are moving higher confirms that it is not a couple of heavy hitters dragging the indexes higher.
It is for this reason that investors should study individual stocks before trading since while the general index may move positively, not all sectors and firms within the index will be moving.
NIFTY 50 Trading Volume and Market Turnover
Market trading activity was significant to share in Tuesday market.
The market data available reflected trading volume of 1,973.61 lakh shares and total traded value of ₹18,631.57 crore.
The free-float market cap was given as at ₹109.11 lakh crore.
These statistics offer an insight into the volume of trading activity and the size of the market represented by the index.
NIFTY 50 Valuation: P/E at 19.43 and P/B at 2.88
The valuation indicators further give valuable guidance to investors following Indian stocks.
The NIFTY 50 price-to-earnings (P/E) ratio was at 19.43, and its price-to-book (P/B) ratio was 2.88.
The P/E ratio allows investors to know how much companies are being valued by the market compared to their earnings, while the P/B ratio compares market value to the book value of a company.
For investors they tend to look at these metrics in addition to earnings growth, company performance, interest rates, and the overall economy to determine if the markets are overvalued.
NIFTY 50 52-week high and low: What is the current position of the index?
The 52-Week Trading Range of NIFTY50 is a useful indicator for analyzing the recent performance of the benchmark.
52-week low: 22,179.90
52-week high: 26,373.20
Current level of the index: 23,659.75
The index stays higher than it is for 52 weeks but lower than it was for the year.
This shows that the mark is still far away from the highest level of last year.
Investors who buy and hold for the long term can get some guidance from the trend, as past prices don’t forecast future prices.
NIFTY 50 support and resistance levels to keep an eye on
The intraday trading range of Tuesday suggests the following levels to watch.
Key levels for 3 November 2026:
Immediate support zone: 23,480-23,500
Resistance zone right away: 23,700-23,705
Last closing level: 23,440.80
Initial level: 23,582.25
The intraday low of near 23,482.80 could be key for short-term traders. On the upside, support in the zone of 23,700-23,705 would be closely watched given that the index has come into this zone in the session.
A breach of the intraday high might bring in additional buyers, while a break below the nearby support zone could lead to increased near-term selling.
These are reference levels based on the provided intraday data, not validated support or resistance levels.
What Should Investors Watch Next?
Investors and traders need to watch out for the NIFTY 50 to hold on to its gains in the second half of the trade.
The market’s next direction may depend on several factors, including:
Trading for heavyweight NIFTY 50 stocks.
Stock portfolio of banking, IT, automotive and financial groups.
Domestic and foreign institutional investor activity.
Global market trends and international economic developments.
Fresh corporate announcements and earnings-related developments.
Do not trade positions solely based on the percentage of gain of the index. Price action, volume, specific stocks and risk management are just as significant.
Conclusion: NIFTY 50 Trades Higher at 23,659.75
On 3rd November 2026, the NIFTY 50 index was up 218.95 points or 0.93% at 23,659.75 as of around 12:16 PM.
Market breadth was positive with 33 stocks advancing and 17 declining. The index was also trading fairly near to its intraday high of 23,705.20.
From here on, traders will be paying close attention to the 23,700-23,705 zone as a key resistance area and 23,480-23,500 region as the current support level for fresh directional cues.